How to Monitor Cisco Devices using Network Performance Monitor
Whenever you dive into the world of networks, you will find Cisco everywhere. The popularity of Cisco in the networking field is unravelled and many network administrators tend to prefer them for the features they come with. Cisco network, or networks in general, monitoring is very important which includes Cisco Routers, Firewalls, and other access points especially in the case of large networks as one fault can result in the entire network being down for quite some time. Response time also holds a critical place when it comes to high-performance networks. There are tons of solutions present for network monitoring but the one that we believe is the best is using the Network Performance Monitor by Solarwinds.
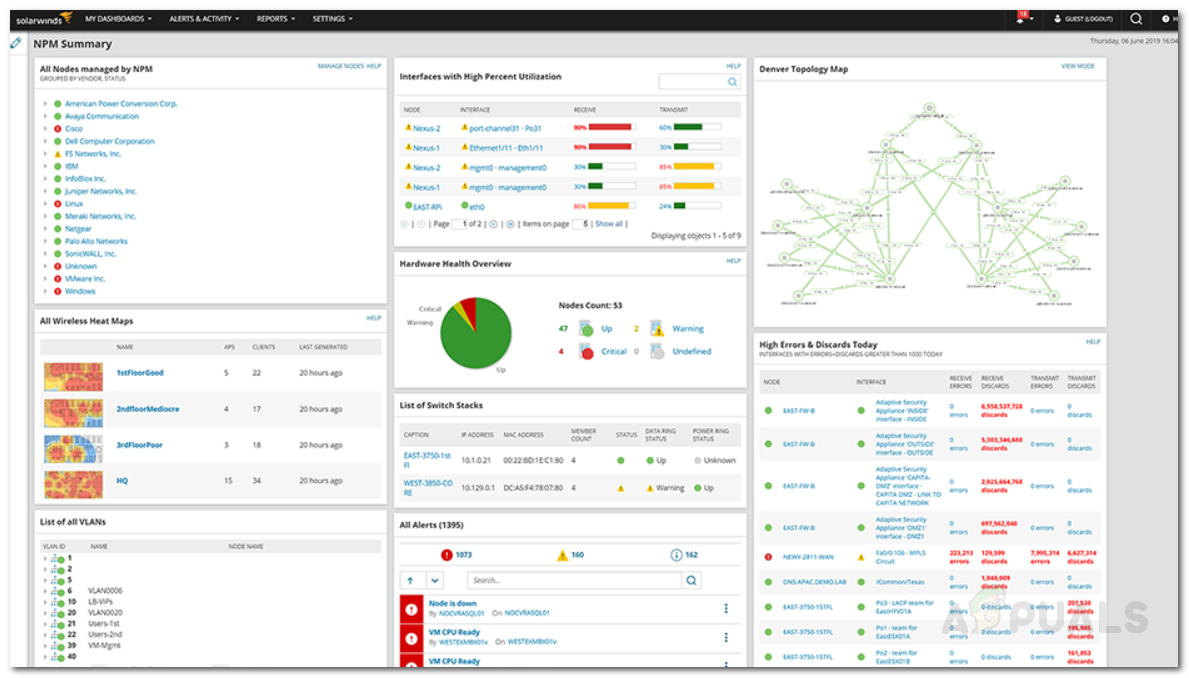
The Network Performance Monitor (NPM) is a tool developed by Solarwinds that lets you monitor network devices with multi-vendor support to help monitor the health/performance of your network and resolve performance issues should there be any. This is done with the help of their deeper visibility or smarter visibility feature that monitors your Cisco Systems providing visual analytics to make it human-friendly. With an extravagant list of features, NPM happens to be an industry-favorite and network admins do not require an introduction about Solarwinds. The process of adding your devices to NPM is fairly easy via the Network Discovery Wizard (also known as Network Sonar Wizard), thanks to their Orion Platform.
Network Performance Monitor
To be able to follow through the guide below, please make sure you have deployed the Solarwinds NPM tool in your network from (here) or you can view monitor network performance on our site that guides you through the installation process of Solarwinds Network Performance Monitor. One of the key features of NPM is it monitors and displays results regarding your network in real time. NPM provides you with network insight in the form of summary and statistics that you can use to resolve issues before they start having an impact on your network. Once you have deployed the tool in your network, you can begin monitoring Cisco devices. Let’s get started.
Monitoring Cisco ACI Devices
To be able to monitor ACI devices on your network, you have to first add the devices to NPM. In case you have multiple APIC nodes in the ACI system, you can monitor them all.
To monitor the health performance of your ACI environment, you will have to enable ACI Polling on one of the APIC nodes. Doing so on all of the nodes is redundant as each APIC has a full view of the ACI environment. Here’s how to add your node and enable ACI Polling:
- First of all, login to your Orion web console as an administrator.
- Once you are in, click on Settings and then go to Manage Nodes. There, click Add a Node to add your device.
- Specify the node by providing the hostname or the IP address of the node.
- After that, select Most Devices: SNMP and ICMP as the Polling method and then follow it up with the Simple Network Management Protocol credentials.
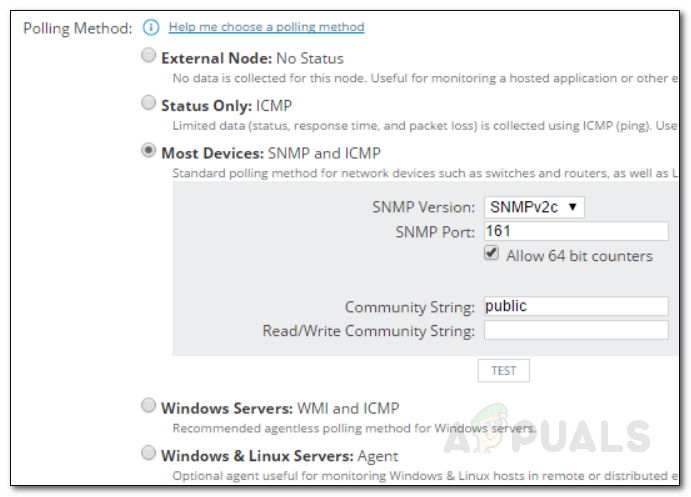
Polling Method - Under the Additional Monitoring settings, make sure to tick the Poll for Cisco ACI option. Provide the credentials for the Cisco ACI Controller and then click Test.
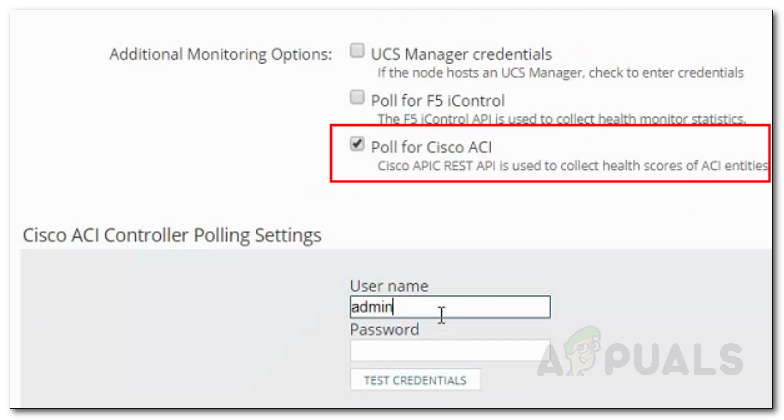
ACI Controller Credentials - Once done, from the list provided, choose whatever you wish to monitor such as memory usage, etc. on your device and then click Next.
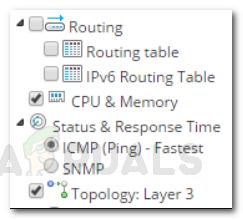
Monitored Resources - Go through the device properties again to make sure everything is fine.
- You can change the Polling values which controls the frequency at which the status of the node is updated.

Polling Values - Other than that, you can also change when a node goes to Warning or Critical state in the Alerting Thresholds section.
- After you have finalized everything, click on OK, Add node to add your node.
Monitoring Cisco ASA Firewalls
If you wish to monitor ASA Firewalls on your network, you will have to add it as a node and then enable CLI polling. Enabling CLI Polling helps in displaying accurate information about your Cisco ASA device as well as it provides additional ASA-specific details. Here’s how to set it up for monitoring:
- Get to the Add Node panel via Settings > Manage Nodes > Add Node.
- Specify the IP address of the device.
- Choose Most Devices: SNMP and ICMPas the polling method and then provide the SNMP credentials.
Polling Method - Move down to the Cisco Nexus or ASA device section and tick the Enable CLI Pollingoption.
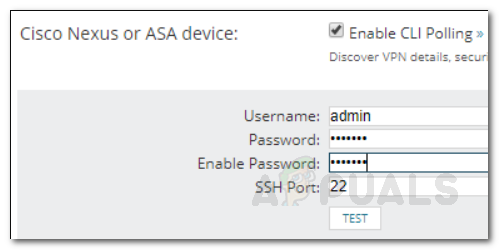
Enabling CLI Polling - Provide the credentials and then click Test to make sure the provided credentials are authentic.
- If you wish to use templates, select it. Device Templates are commands that are executed on a device.
- Finish the Add Node Wizard.
Monitoring Cisco Nexus Devices
The monitoring of Cisco Nexus devices follows the same procedure as the ASA Firewalls. Thus, if you wish to monitor Cisco Nexus devices on your network, go ahead and follow the instructions given above. The only difference would be the IP addresses of the devices and the credentials for the CLI polling.
Monitoring Cisco SwitchStack
Cisco SwitchStack can also be monitored via the Network Performance Monitor. Monitoring SwitchStack enables you to view the health of individual members of SwitchStack as well as monitor power and data connections that coexist between the members.
To monitor Cisco Switchstack, you will have to add it to NPM as a node via the steps provided under the Monitoring Cisco ACI Devices. Since you won’t be monitoring ACI devices in this case, there’s no need to enable ACI Polling. The rest can be followed as explained.
Monitoring the Health of Cisco Devices
Once you have added the devices that you want to monitor to NPM, you can view the results/monitor the data in the Orion NPM Dashboard. On the dashboard, you will be able to find all the devices that you have added and the data being monitored.
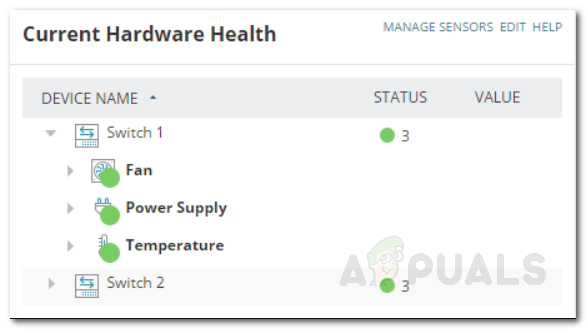
The results may take some time to be shown. This is because NPM will have to first gather enough data to show you the statistics. Enjoy keeping an eye on your devices!
